

Tracking Market Trends for Collectible Drinkware
Last Updated: October 22, 2026
Quick Summary
Tracking market trends for collectible drinkware means separating real demand from noise using completed sales, sell-through rates, and release data rather than asking prices and social media buzz. Log realized prices against asking prices weekly, score each cup on scarcity, demand, condition, authenticity, and trend direction, and confirm any signal across at least two sources before acting.
- Only completed sales show what buyers actually paid; active listings reflect seller optimism, not demand.
- Fewer than five completed sales in a tight window is a data point, not a trend.
- A 40% gap between asking and sold prices is a warning sign, not a buying opportunity.
- Score cups on a five-factor rubric out of 25; above 20 is a strong hold, below 12 means soft resale.
- New supply caps resale, so a restock announcement can invalidate a price trend overnight.
Table of Contents
- Why Collectible Drinkware Trends Are Hard to Read
- The Market Backdrop: What the Numbers Actually Say
- Drinkware Market Research Tools That Give You Real Data
- Tumbler Price Tracking: Asking Prices vs. Realized Sales
- Collectible Cup Value Factors Collectors Should Score
- Building a Repeatable Trend-Tracking Workflow
- Conclusion
- Frequently Asked Questions
Why Collectible Drinkware Trends Are Hard to Read
Tracking market trends for collectible drinkware is the practice of separating real demand signals from noise using completed sales, sell-through rates, and release data rather than asking prices and social media buzz.
Here is the core problem. Collectible drinkware has no single price index. A tumbler's value depends on color, release size, condition, and whether the box survived.
At Tools, Handbags, and More, we watch this gap every week. Customers ask what a limited color is "worth," and the honest answer starts with completed sales, not asking prices.
The Market Backdrop: What the Numbers Actually Say
The numbers give context, not a verdict. No major research house publishes a collectible-drinkware-only figure, so treat every headline number as a broad benchmark.
Start with drinkware overall. According to Grand View Research's regional drinkware estimate, the North American drinkware market was valued at USD 9.13 billion in 2025 and is projected to reach USD 15.21 billion by 2033.
The collectibles side is bigger and faster. Grand View Research's collectibles market report puts the global collectibles market at USD 320.3 billion in 2025, reaching USD 535.5 billion by 2033 at a 6.9% CAGR.
Segmentation by product type
Broad drinkware reports typically split the category into insulated tumblers, travel mugs, water bottles, and everyday cups. For collectible purposes, the segmentation that matters is narrower:
- Insulated tumblers (40oz and similar): the deepest resale market, driven by limited color drops and brand collaborations.
- Travel mugs and commuter cups: steadier everyday demand, thinner collector premiums.
- Water bottles and sport bottles: smaller collector base, but strong seasonal spikes.
- Novelty and licensed drinkware: value tied to the license and the release window, not the vessel.
Regional analysis
North America carries the largest share of both drinkware demand and resale activity, which is why most completed-sale data you can find is domestic. Other regions matter mainly as supply sources for limited runs and as demand pockets for specific collaborations. When you read a regional growth rate, ask whether the models you track are sold in that region, a strong global CAGR does not lift a cup that never shipped there.
Key players and market share
Market reports name the large drinkware brands and retailers that hold share. For a collector, the useful takeaway is concentration: a handful of brands drive most of the limited-edition supply, so release calendars from those brands are your earliest supply signal. Market share at the brand level tells you who can flood resale with a restock; it does not tell you which color will hold value.
Key market drivers
- Reusable-drinkware adoption: steady everyday demand supports baseline resale.
- Limited drops and collaborations: scarcity events create the collector premiums.
- Resale infrastructure: sold filters and auction records make price discovery faster.
- Collectibles overall growth: a rising collectibles market supports scarcity premiums across categories.
What does this mean for a tumbler collector? Two things:
- Broad drinkware demand is steady, which supports everyday resale.
- Collectibles overall are growing, which supports scarcity premiums.
Neither number proves a specific cup will hold value. Use them as the tide, not the wave. The segmentation and player concentration above tell you where to look; the completed-sale data in the next section tells you what buyers actually paid.
Drinkware Market Research Tools That Give You Real Data
Good drinkware market research tools answer one question: what did buyers actually pay? Everything else is commentary.
Here is what we track and where to find it:
| Source Type | What It Shows | Watch Out For |
|---|---|---|
| Completed auction sales | Realized prices, bid counts | Small sample sizes |
| Marketplace sold filters | Recent paid prices | Bundles skew averages |
| Retail release calendars | Supply and drop timing | Leaks that never ship |
| Collector forums and groups | Early demand chatter | Hype without sales |
| Brand restock announcements | Future supply | Restocks that cap resale |
A common mistake is trusting one source. Sold filters on marketplaces show fast-moving colors. Auction results show rarer pieces. Release calendars show what supply is coming. You need all three to read a trend.
Tumbler Price Tracking: Asking Prices vs. Realized Sales
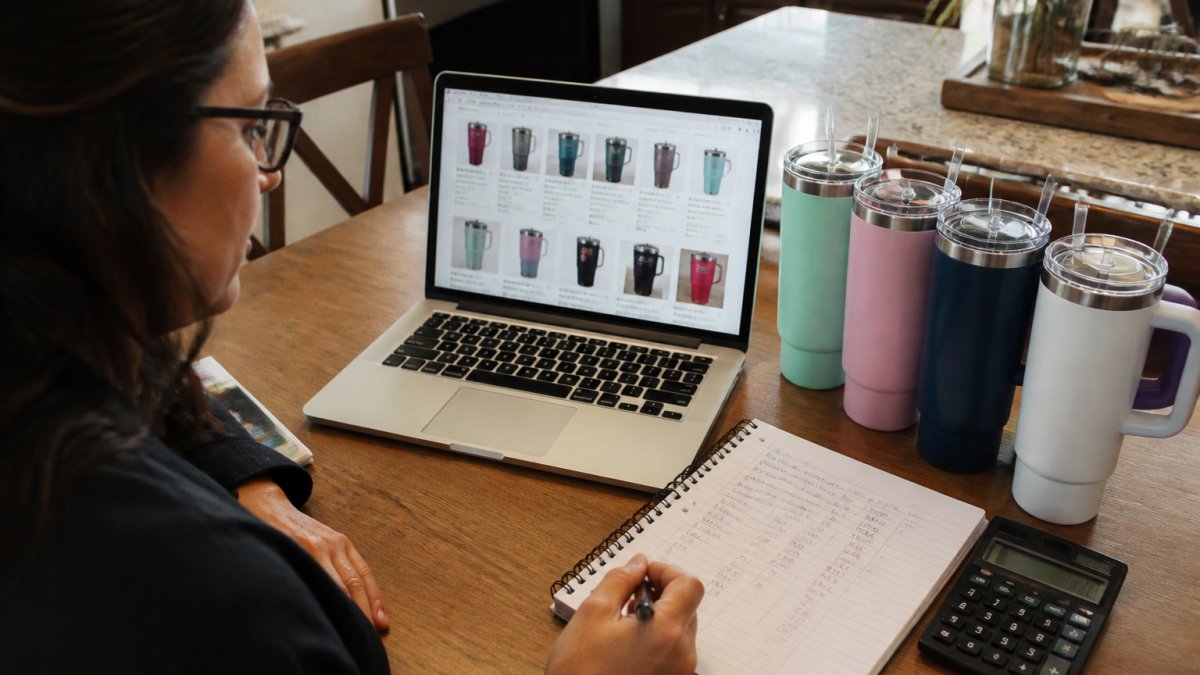
Tumbler price tracking only works when you separate asking prices from realized sales. Asking prices measure seller optimism. Realized sales measure demand.
NEW IN BOX, CREAM STANLEY 40oz TUMBLER B-342 →
Collectible Cup Value Factors Collectors Should Score
Score each cup on a fixed rubric so your tracking stays consistent. Collectible cup value factors fall into five categories, and a simple 1-5 score per category beats gut feel every time.
- Scarcity (1-5): How limited was the run?
- Demand (1-5): How many recent completed sales?
- Condition (1-5): New in box, or used with wear?
- Authenticity (1-5): Verifiable release and packaging?
Add the scores for a total out of 25. Anything above 20 is a strong hold. Below 12, expect soft resale. This rubric is the backbone of tracking market trends for collectible drinkware because it forces the same questions every time.
Building a Repeatable Trend-Tracking Workflow
A repeatable workflow turns scattered observations into a real trend read.
Step 1: Pull completed sales. Collect the last 30 days of sold prices for your target models.
Step 2: Log asking prices. Note active listings for the same models. Calculate the ask-to-sold gap.
Step 3: Check supply signals. Review release calendars and restock news.
Step 4: Score each cup. Apply the five-factor rubric.
Step 5: Validate the trend. Confirm a signal across at least two sources before acting. One hot sale is noise.
The tracking dashboard: fields and formulas
Build a simple spreadsheet with one row per model and one column per field. The fields below are the minimum that make the data comparable:
- Model and color: the exact release name, so you never mix two similar cups.
- Release date and edition size: the supply context for every price you log.
- Completed sales count (30 days): your sample size. Fewer than five is a data point, not a trend.
- Median realized price: use the median, not the average, so one outlier bundle does not skew the read.
Two formulas do most of the work. The sell-through ratio (realized ÷ asking) tells you whether sellers are pricing to the market. The week-over-week change in median realized price tells you direction. Trends show up in the slope, not a single row.
Review cadence
- Weekly: update completed sales and asking prices for models you are actively watching.
- Monthly: recalculate medians, sell-through ratios, and rubric scores; flag any model whose direction changed.
- Quarterly: review the whole dashboard against release calendars and drop the models that no longer trade.
Validation checks: avoiding false signals
A trend is only as good as the sample behind it. Run these checks before you act:
- Small sample sizes: fewer than five completed sales in a tight window is a data point, not a trend. Wait for more sales or widen the window.
- Hype cycles: a viral post can lift asking prices without lifting realized prices. If the ask-to-sold gap widens while sales volume stays flat, it is hype, not demand.
- Seasonality: compare the same weeks year over year where possible. A seasonal spike is not a durable trend.
- Manipulated listings: repeated relists at the same price, or sales between the same accounts, can fake a market. Cross-check against a second source.
- Short-lived viral attention: a cup that trends for a week and then goes quiet is a spike, not a trend. Confirm the signal holds across at least two review cycles.
Conclusion
Reading this market is a discipline, not a hunch. The collectors who get it right track completed sales, score condition and scarcity, and validate every signal before they buy.
That is where we come in. Tools, Handbags, and More carries sought-after drinkware like our PINK STANLEY 40oz TUMBLER and WHITE STANLEY 40oz TUMBLER, both $35.00 new in box. Can't find a specific color?


Frequently Asked Questions
How do you track trends in collectible drinkware?
Start with realized sale prices rather than asking prices. Log completed sales for the specific colorways and sizes you follow, note the date and condition, and compare weekly averages over at least a month. Pair that with category context: Grand View Research puts the broader collectibles market at $320.3 billion in 2025 growing to $535.5 billion by 2033. That mix of product-level sales data and category benchmarks keeps your read grounded.
Where can you check resale prices for collectible tumblers?
Use marketplaces that publish completed sales rather than active listings, since asking prices tell you what sellers hope for, not what buyers paid. Record the sale date, colorway, size, and condition for each result, then build a simple spreadsheet average. Cross-check against retail listings for new-in-box stock, like the 40oz Stanley Quencher H2.0 FlowState Tumblers at $35.00, so you can see how far resale sits above retail. Two sources beat one, and three months of history beats a single screenshot.
What factors affect the value of collectible drinkware?
Condition, authenticity, colorway scarcity, size, and whether the original box and lid are included all move price. Limited-edition releases with documented production runs hold value better than restocked colors. Seasonality matters too: demand for certain colors spikes around gift-giving periods. Score each factor on a simple scale and track it alongside sale prices, so you can tell whether a price jump came from genuine scarcity or a temporary spike in attention.
How often should collectors review drinkware market trends?
Weekly is enough for active listings and new releases, while monthly is better for resale averages and category data. Review quarterly for the bigger picture, since market forecasts like the 6.9% CAGR projected for collectibles through 2033 shift slowly. The key is consistency: a fixed weekly check-in produces comparable data, while sporadic browsing produces anecdotes. Keep a running log so each review builds on the last instead of starting over.